THE REAL APPLICATION
See the details.
Keep the context.
Actual Wi-Fi Commander screens are shown throughout this page. Example readings reflect the network and hardware used for the screenshots; your results will vary. Select any screenshot to open it at full size.
Showing all 17 screenshots
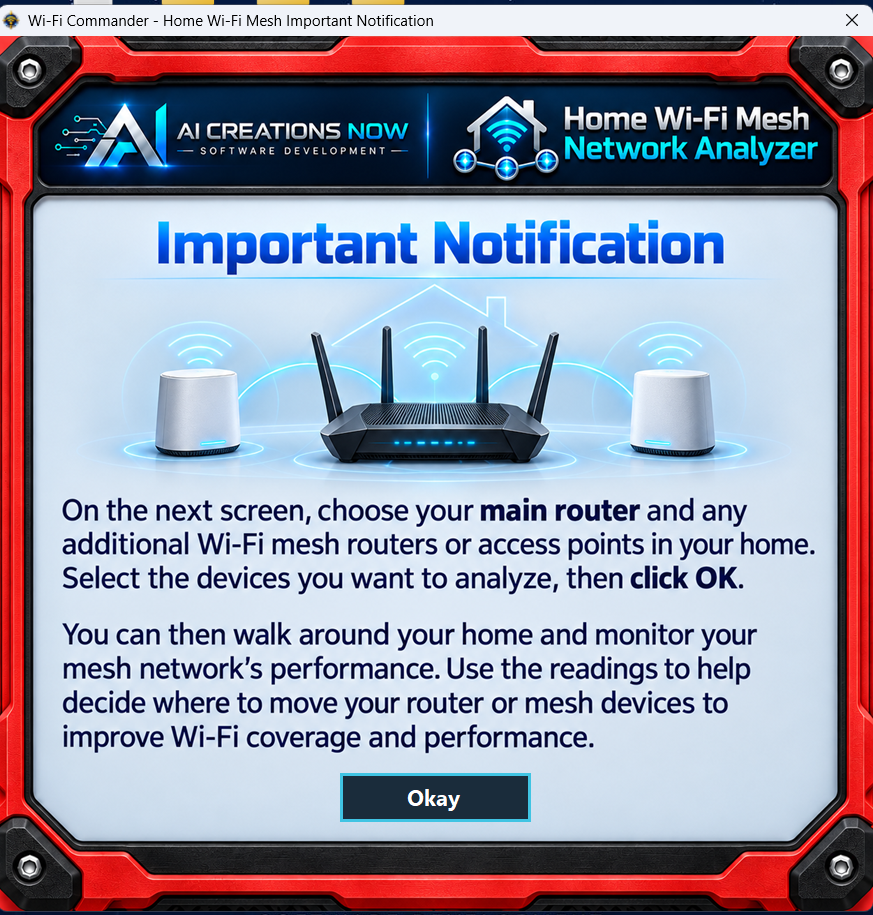
The in-app introduction explains which equipment to select before you begin.
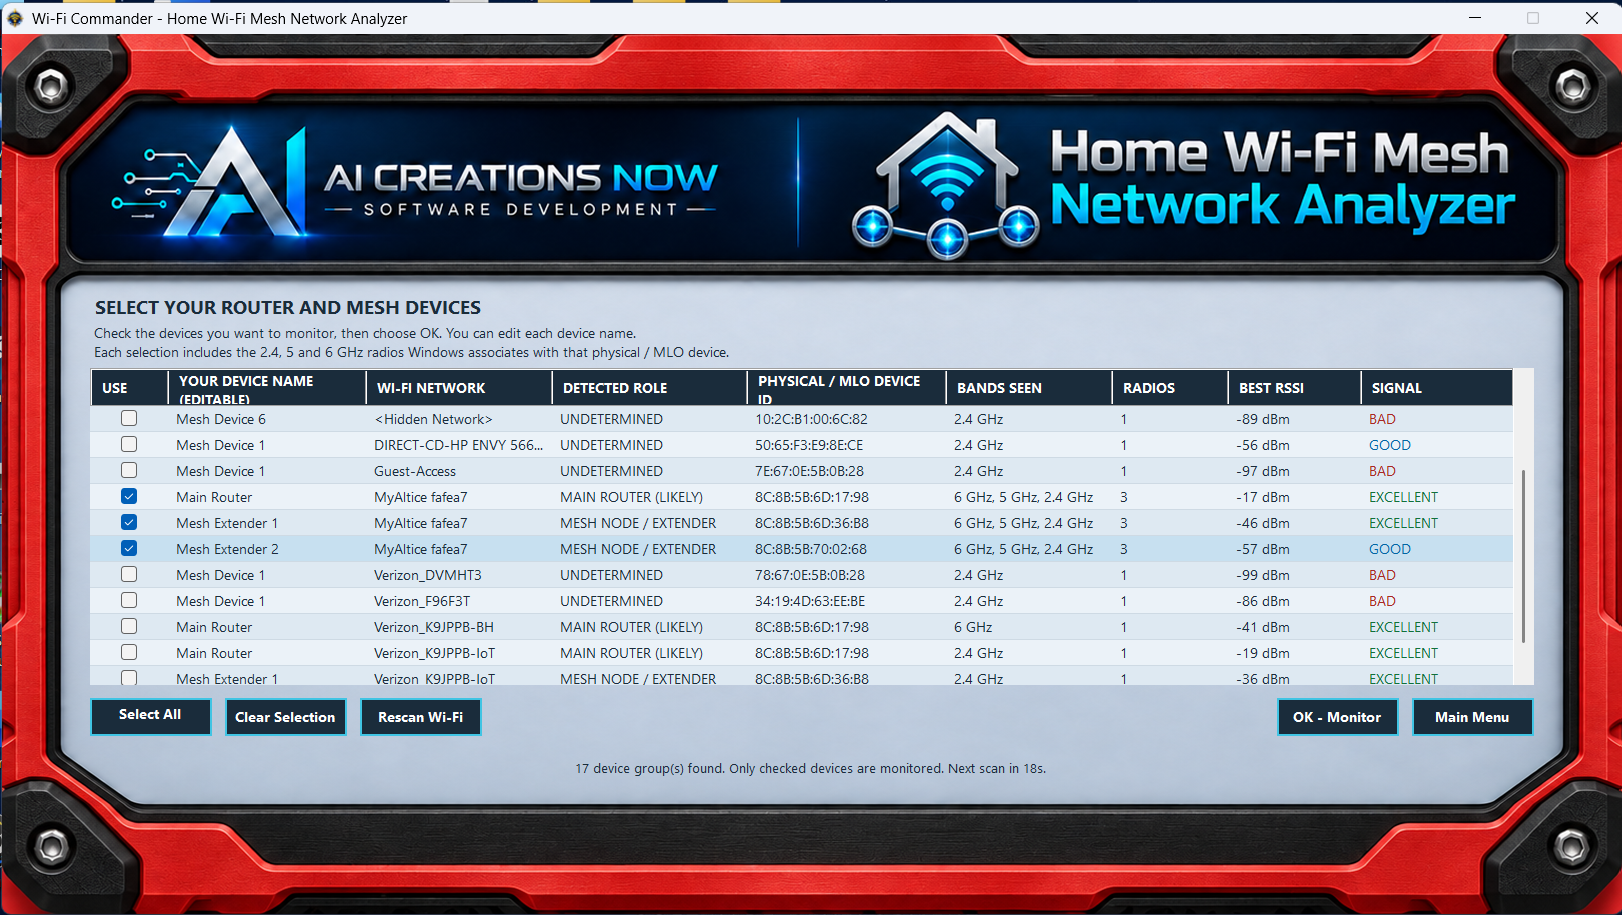
Check the router and mesh devices you want to monitor. Edit their names, rescan nearby Wi-Fi, or change the selection before choosing OK – Monitor.
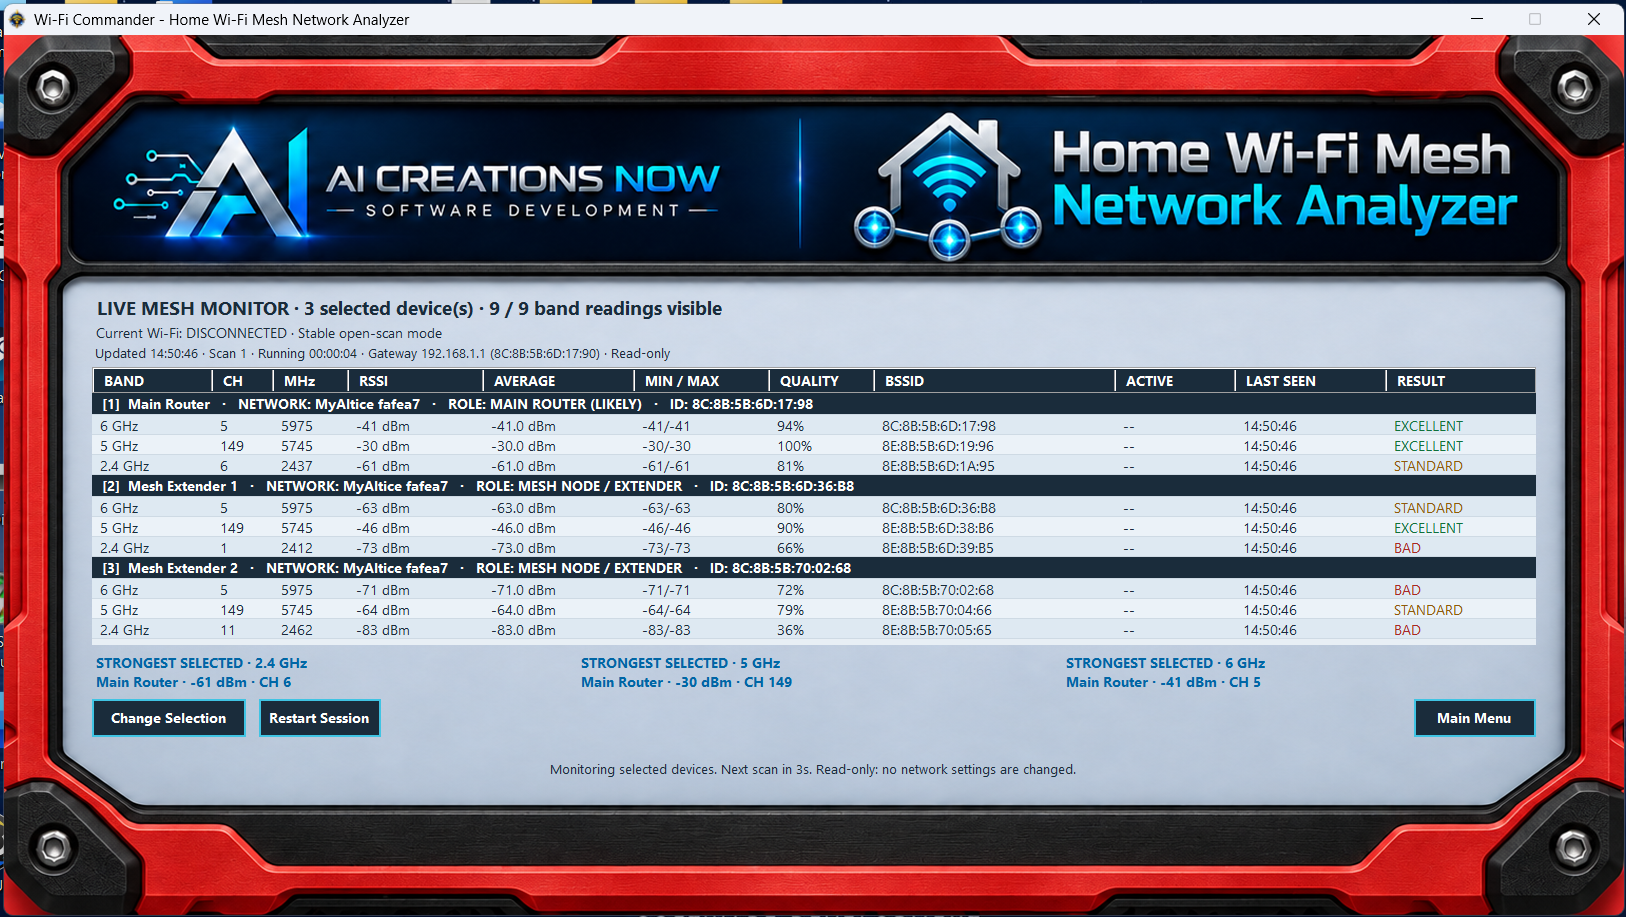
Compare current, average, minimum, and maximum signal for your selected devices. Review channel, frequency, signal quality, last-seen time, and the strongest selected signal on each available band.
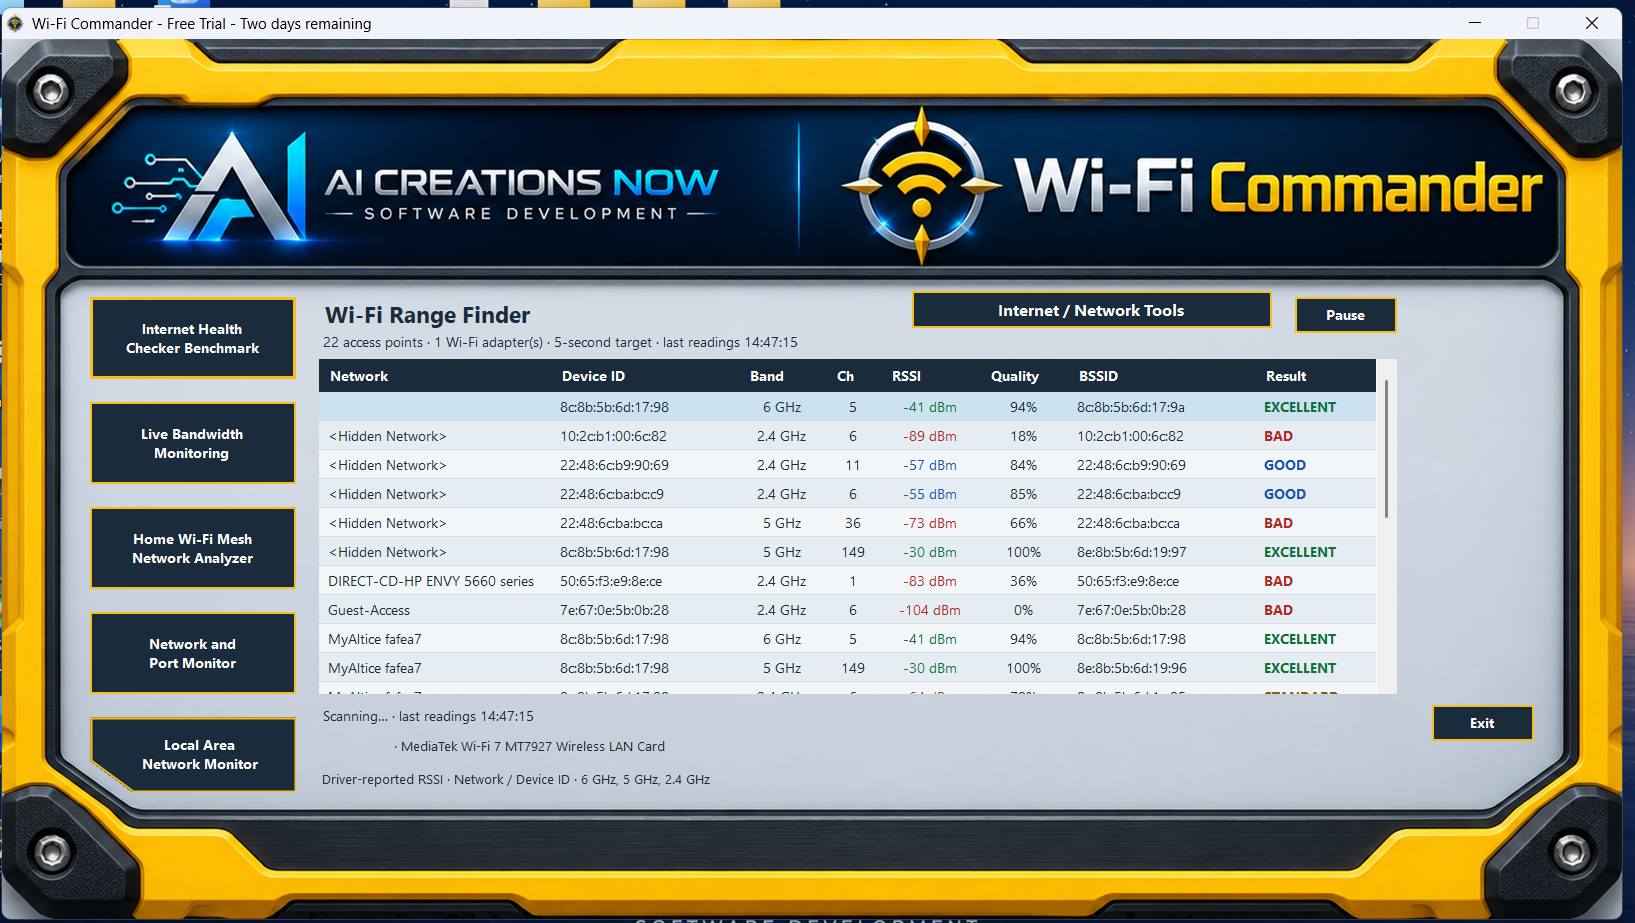
The live table shows nearby access points with signal strength in dBm, signal quality, an easy-to-read rating, and the radio identifiers and device groups reported by Windows. Pause the readings when you want a closer look. The screen’s buttons open Internet Health, Bandwidth, Mesh, Ports, LAN, and Network / Internet Tools.
Range Finder measures signal strength, not distance in feet or meters. An enabled compatible Wi-Fi adapter is required; Ethernet alone cannot scan nearby Wi-Fi.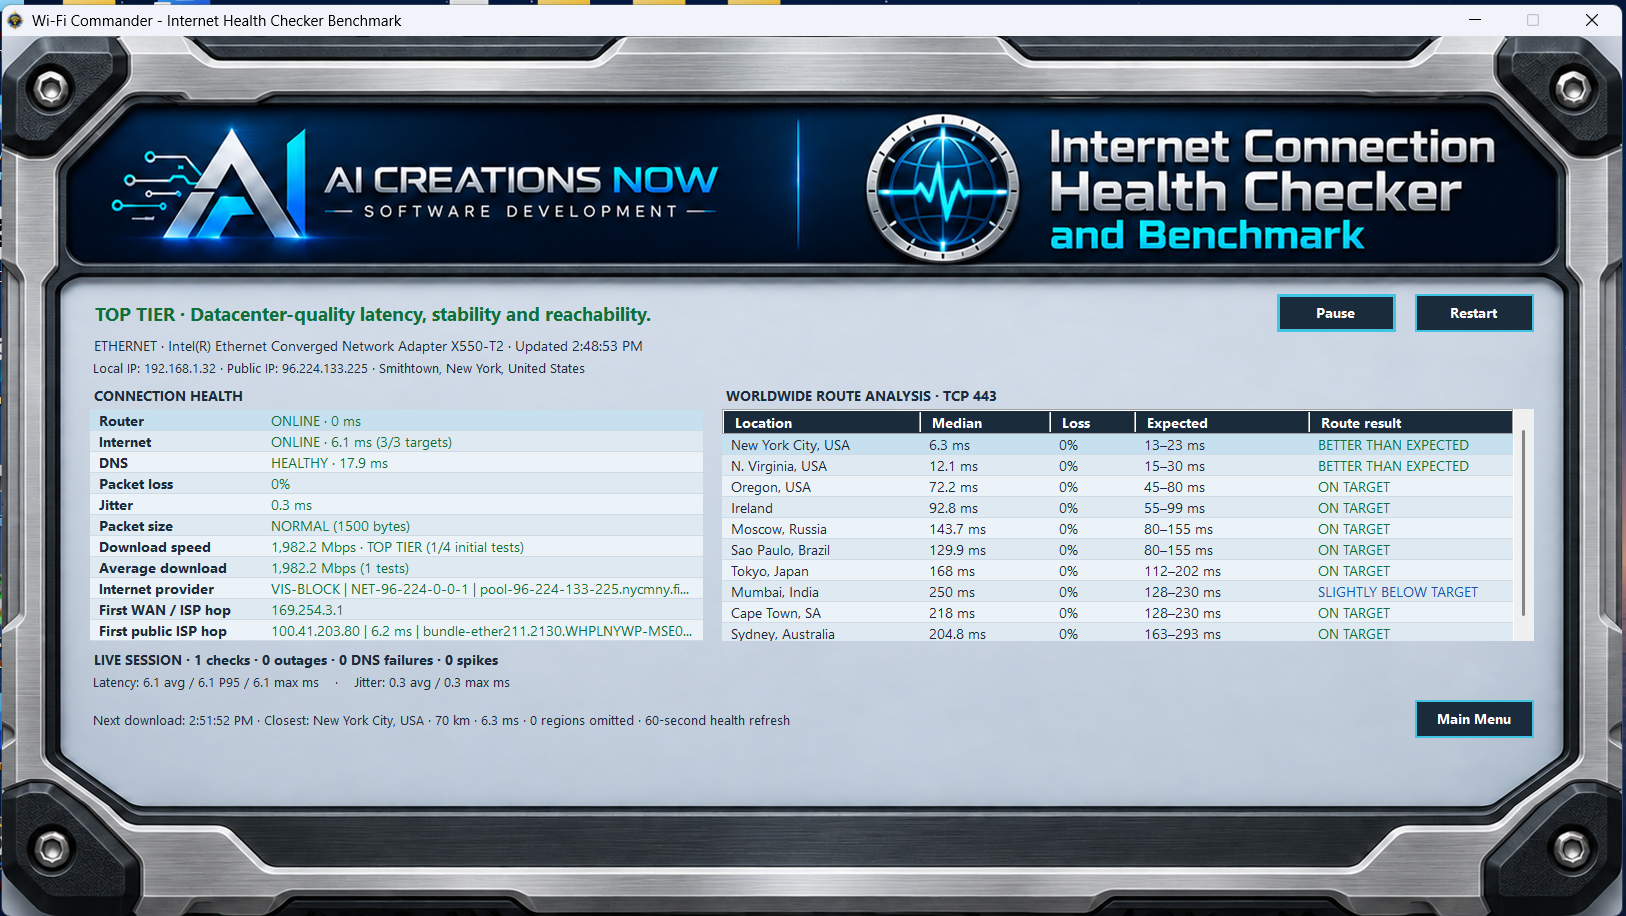
See your router response, Internet response, DNS health, packet size, connection interruptions, and latest and average download results in one detailed view. A regional table compares connection response across up to ten worldwide regions.
Latency is the wait for a response. Jitter is how much that wait varies. Packet loss means some test requests did not return. The session summary tracks response-time and jitter statistics, outages, and spikes so you can see whether problems repeat. Connection details include your provider, public address, and approximate IP location. Pause stops monitoring and transfers; Resume or Restart begins a new session.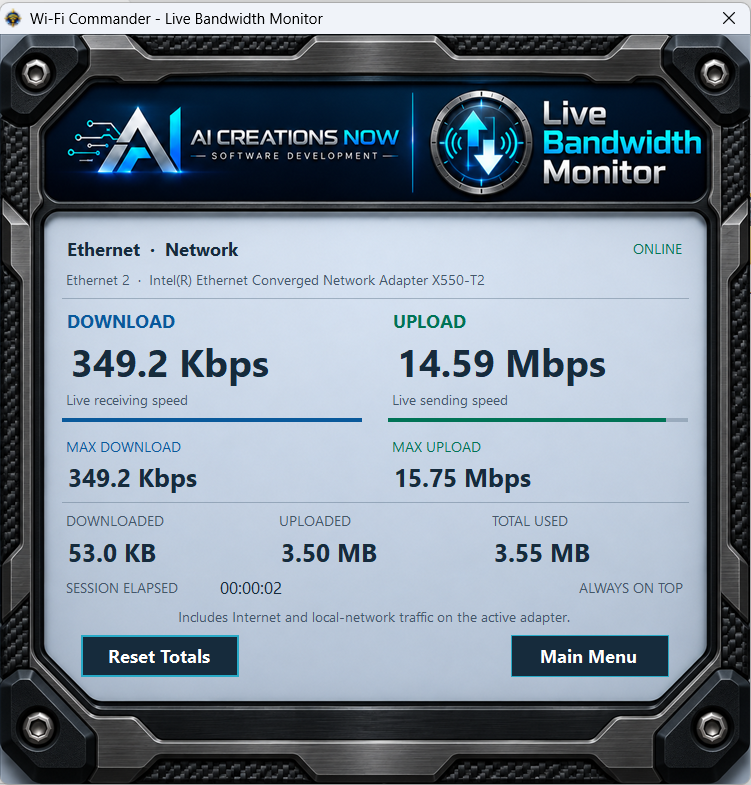
The compact, always-on-top monitor shows current download and upload rates, peak rates, transferred totals, and elapsed session time. Use Reset Totals when you want a fresh starting point.
This reads traffic on one selected physical adapter, including Internet and local-network traffic. It does not run a speed test or show usage by individual application.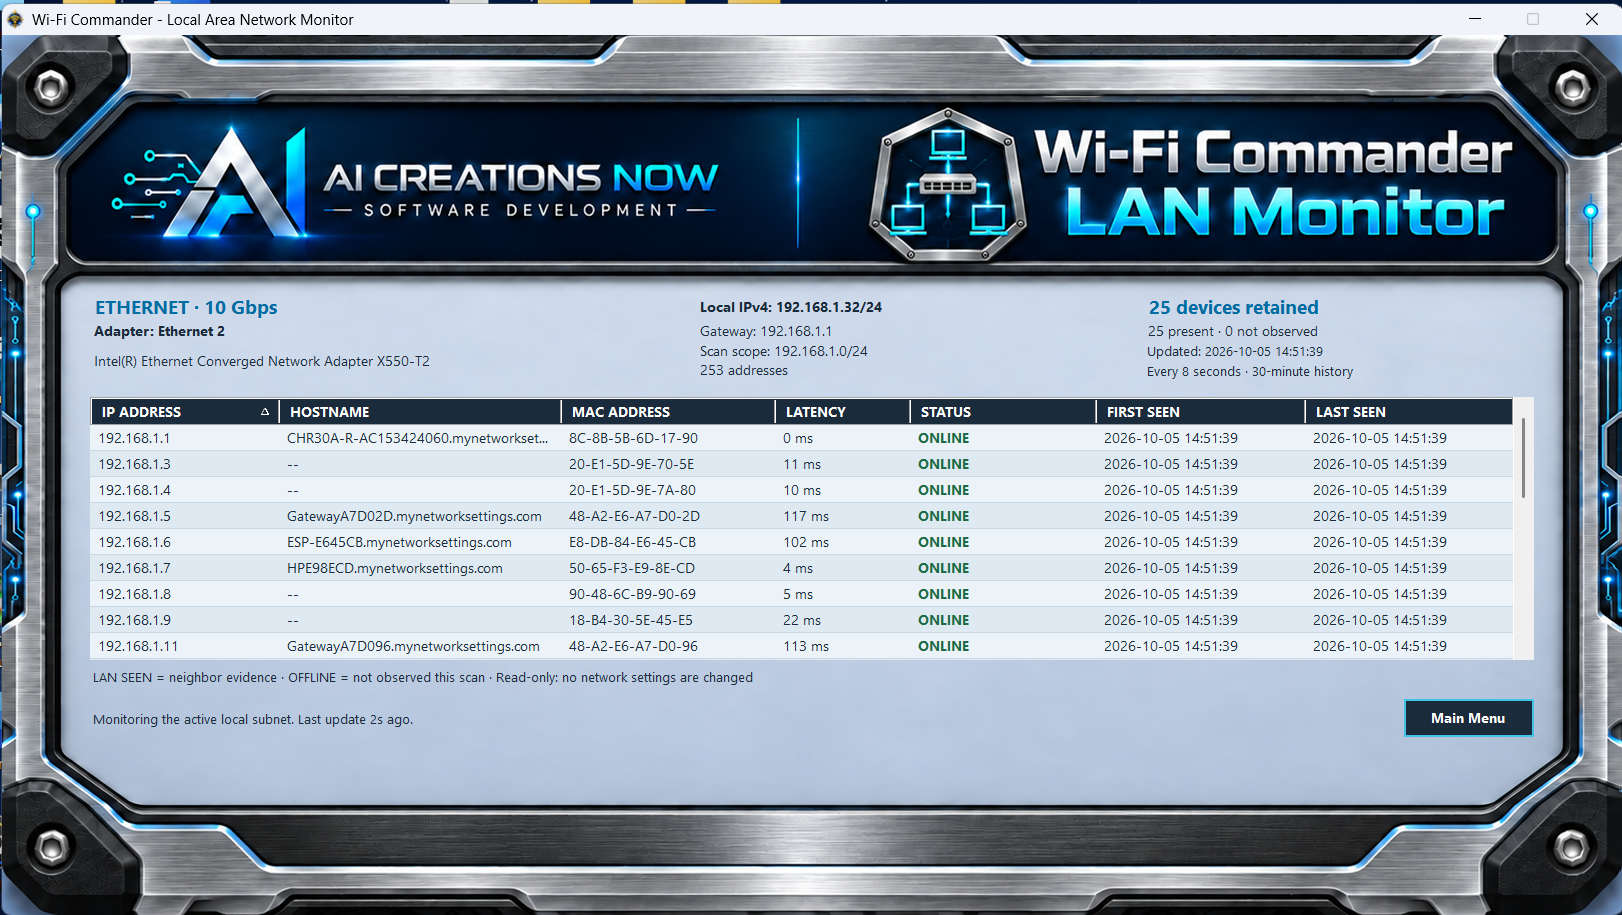
Review detected local IP addresses, available device names, hardware addresses, response times, and first- and last-seen times. The displayed scan scope tells you which private IPv4 network is being monitored.
Online means a device answered a ping. LAN Seen means it was observed through local neighbor information. Sleeping, isolated, or filtered devices may not appear; this is not an exhaustive inventory of every subnet or VLAN.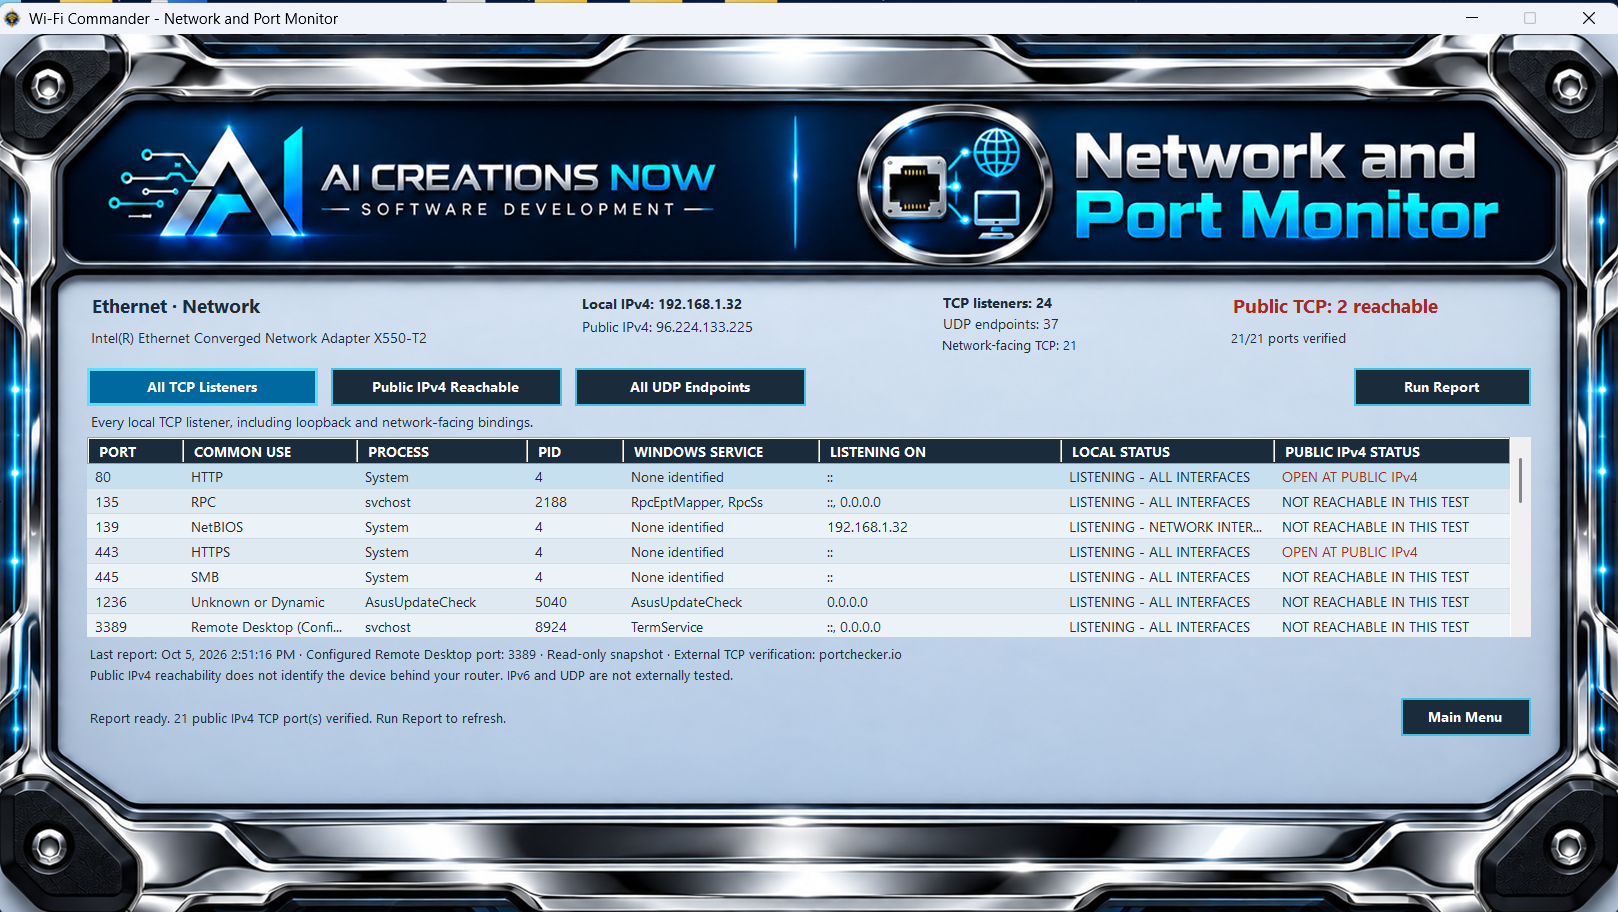
See TCP listeners and UDP endpoints, the programs and services behind them, and the addresses they use. Switch between all TCP listeners, publicly reachable IPv4 results, and the local UDP list. Use Run Report to refresh.
External checks test public IPv4 TCP ports only. A responding public port may lead to your router or another device; it does not prove that this PC is reachable. UDP and public IPv6 are not externally tested.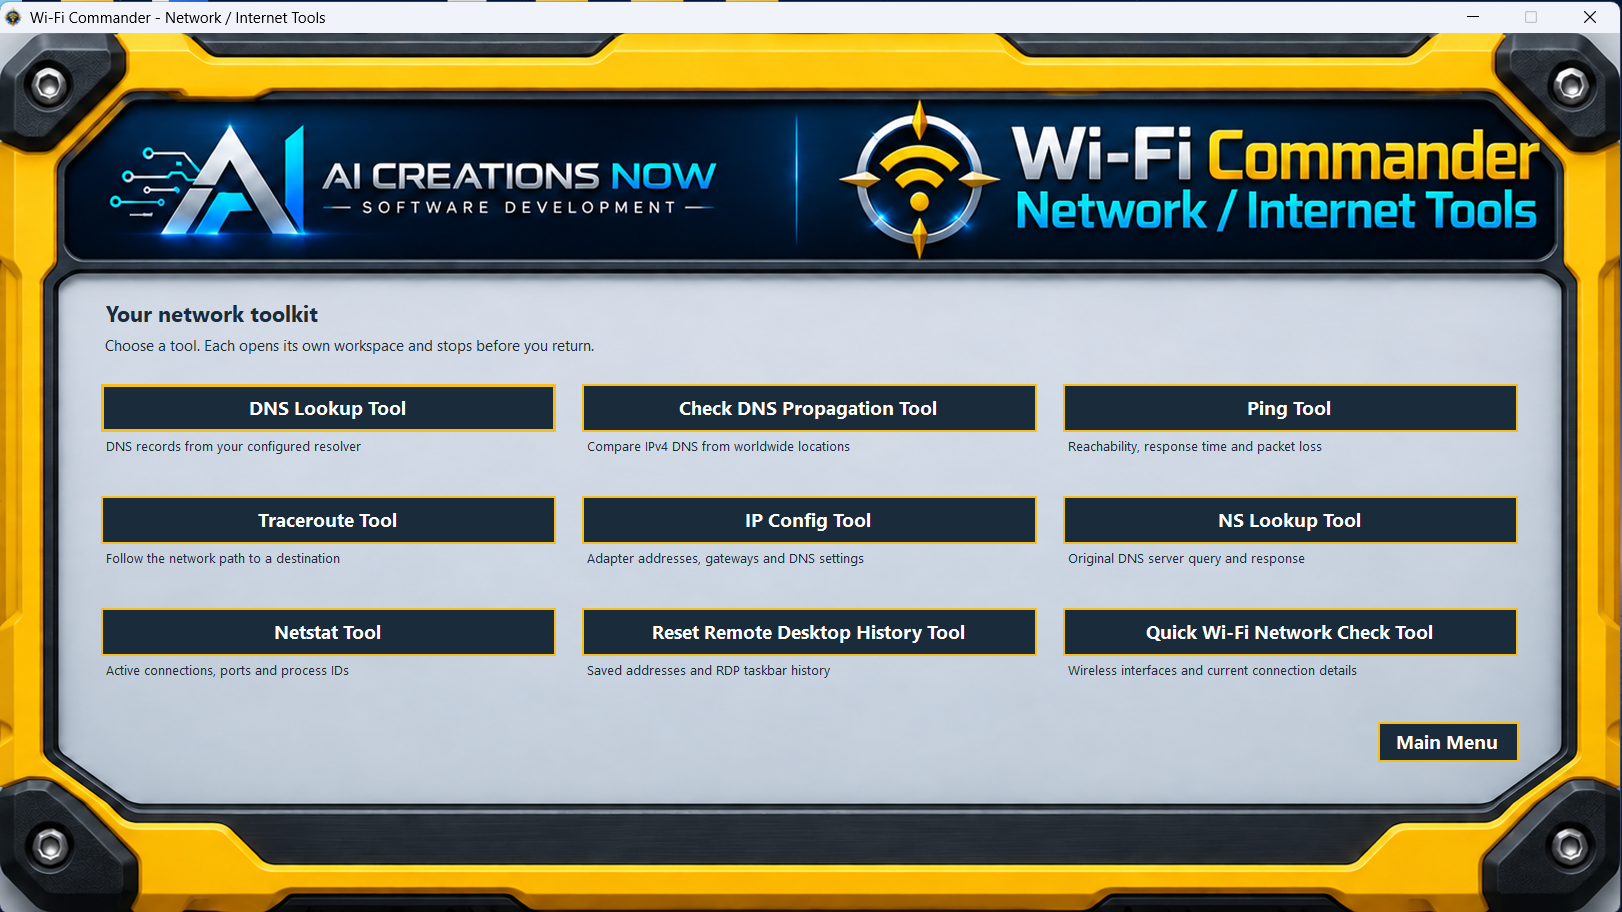
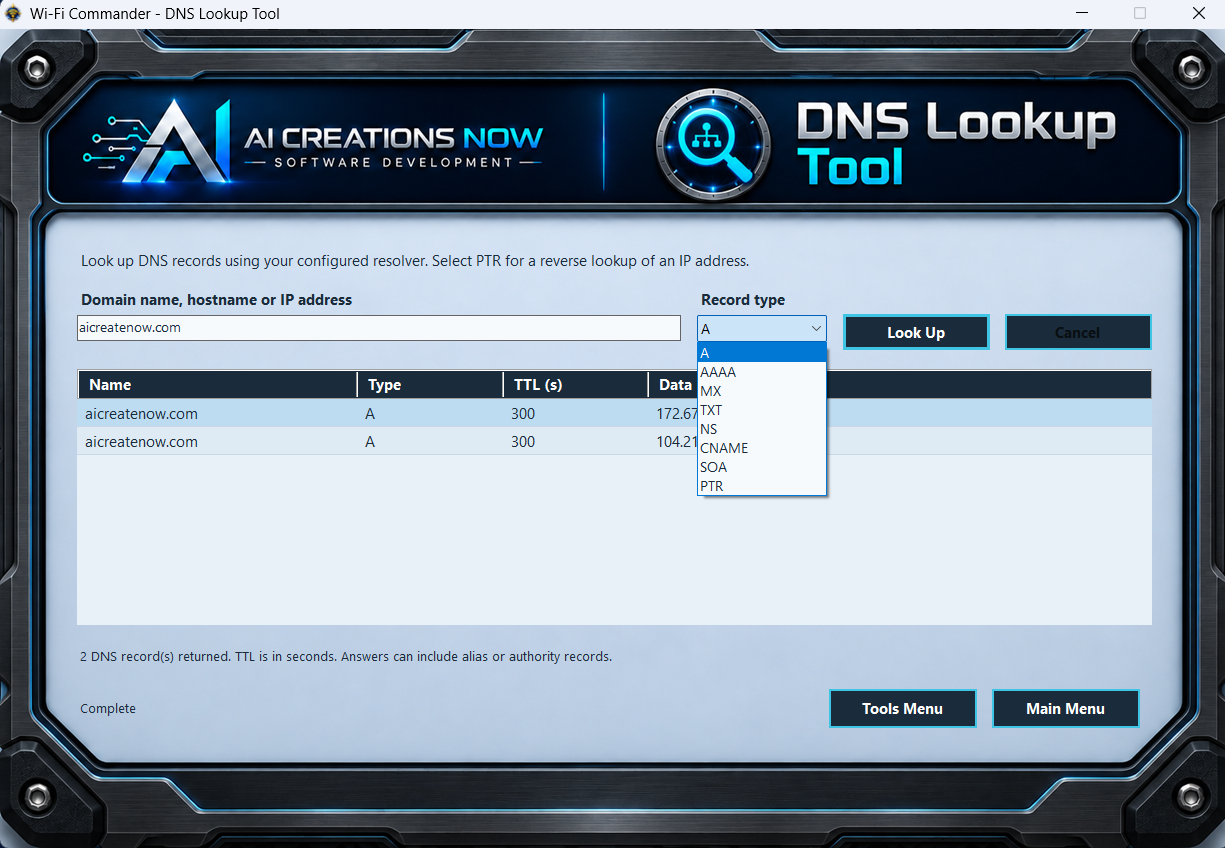
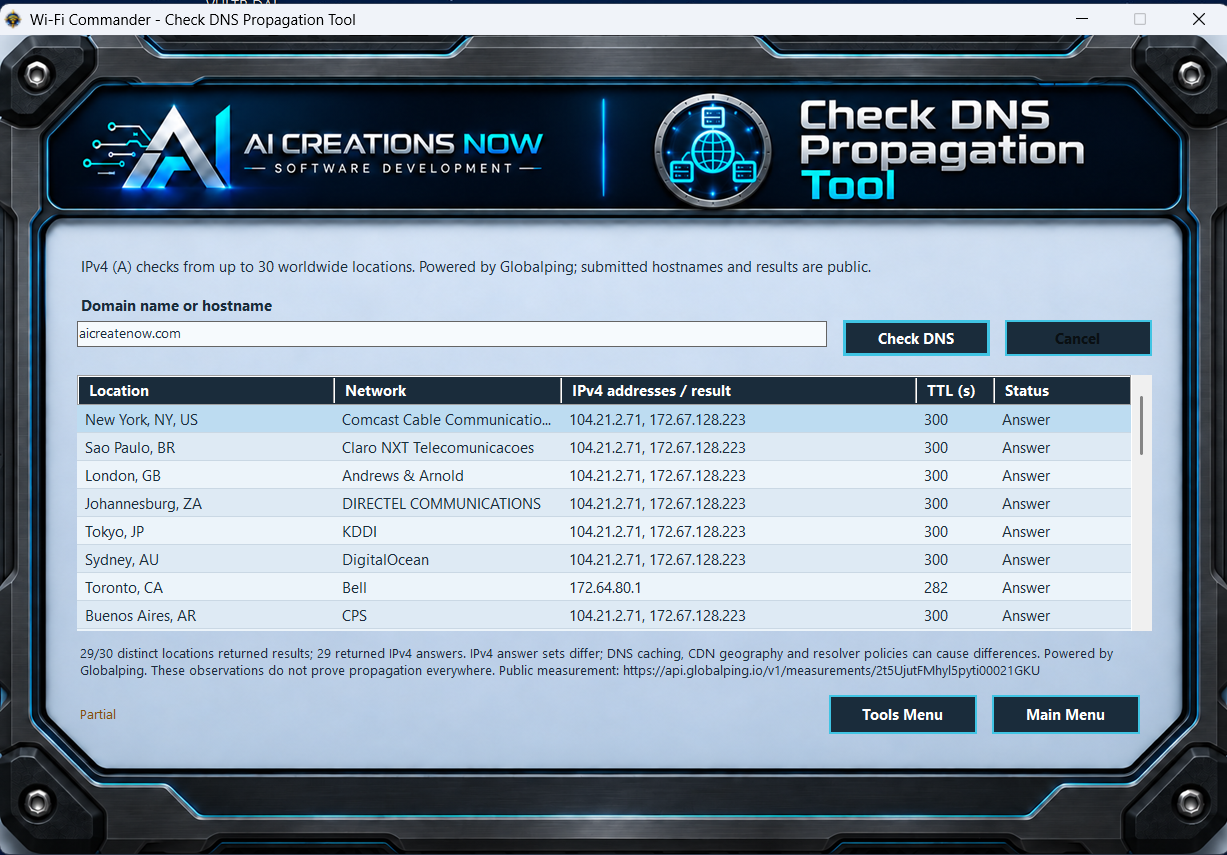
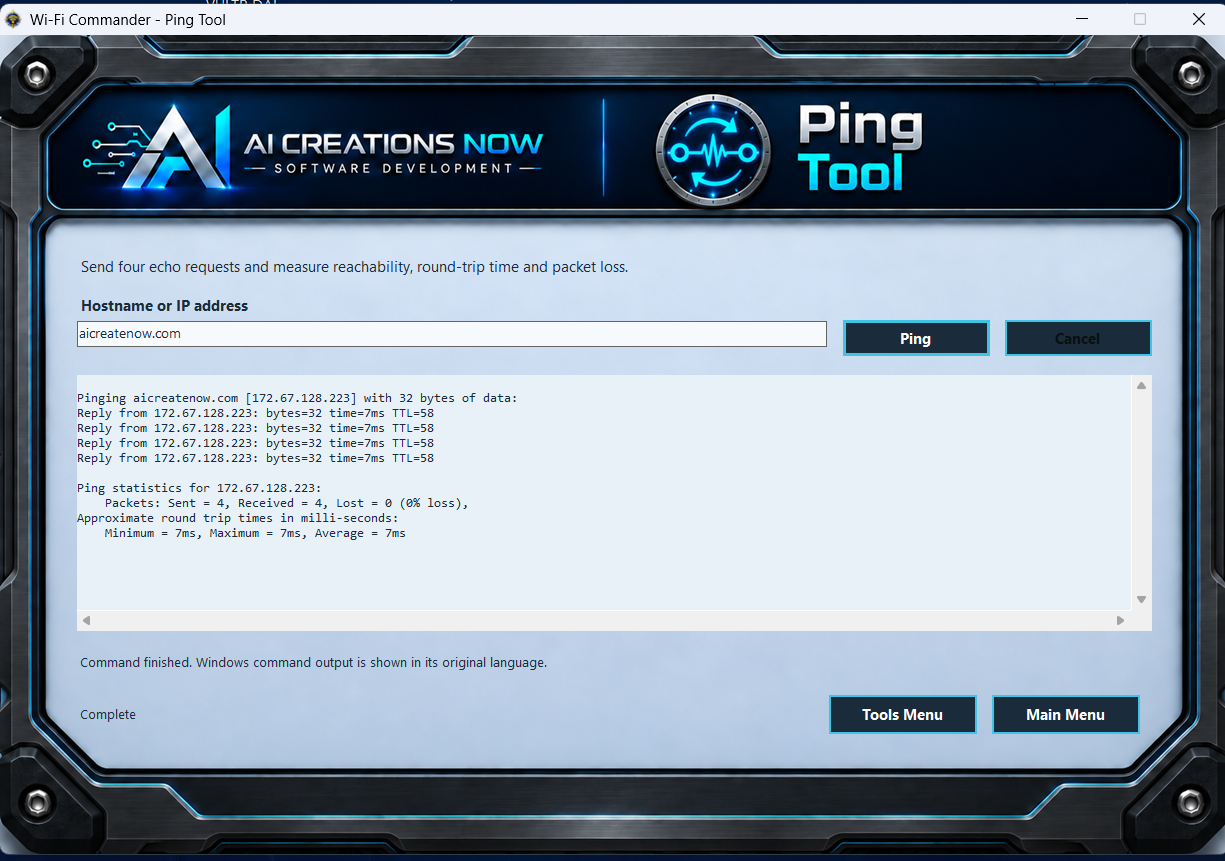
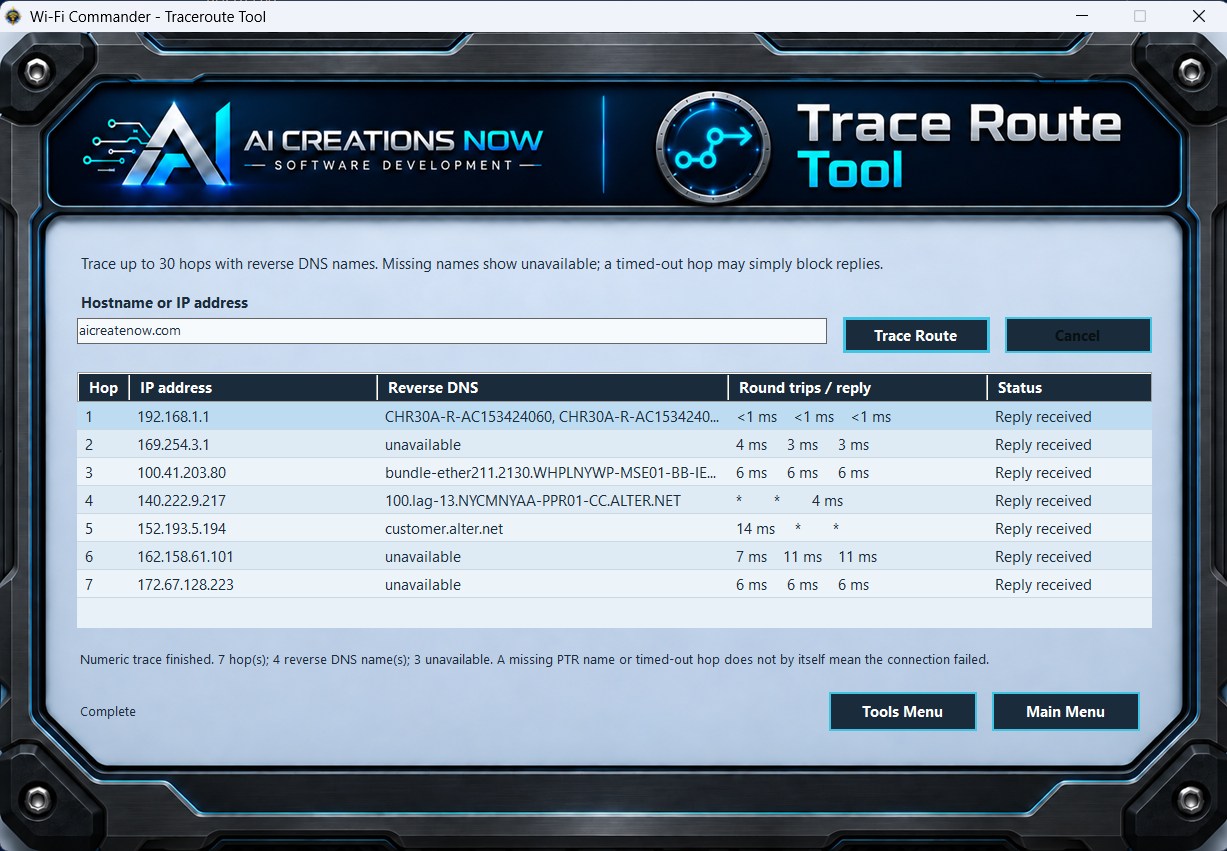
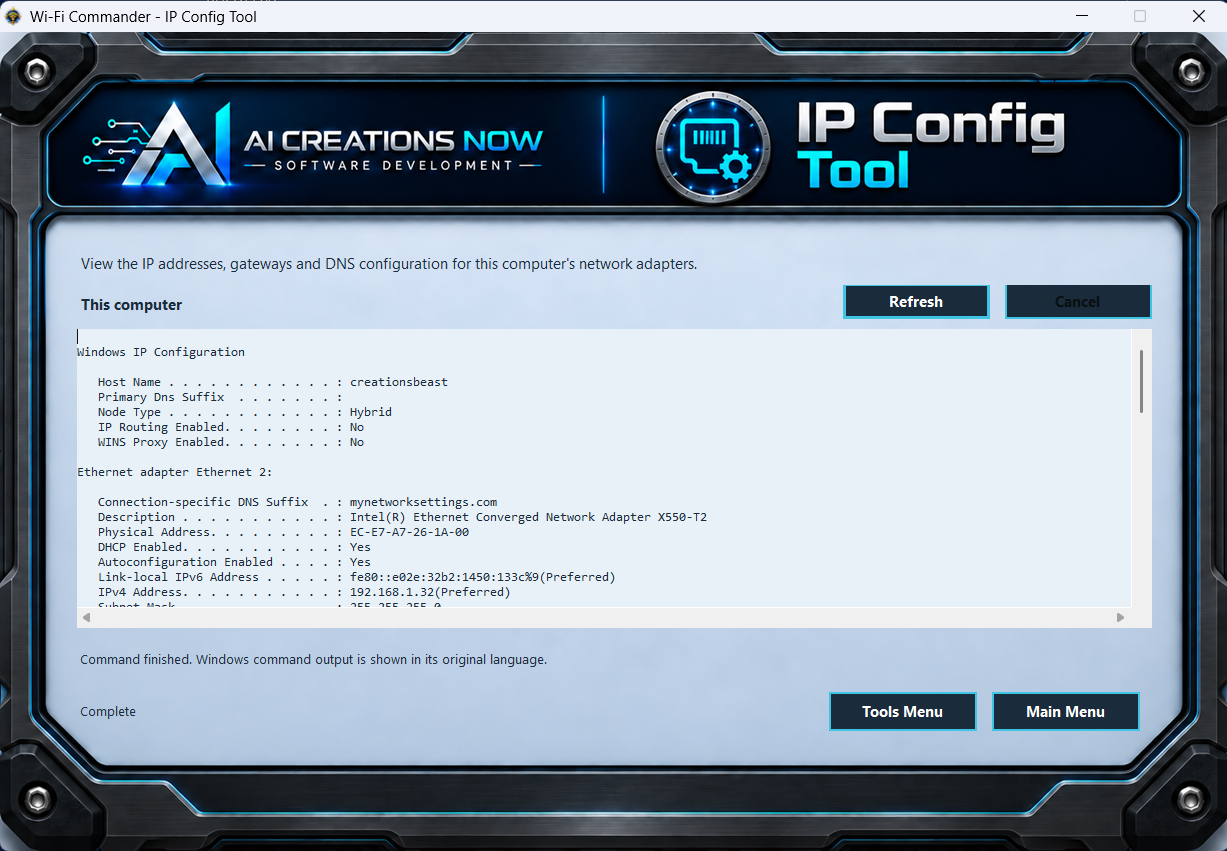
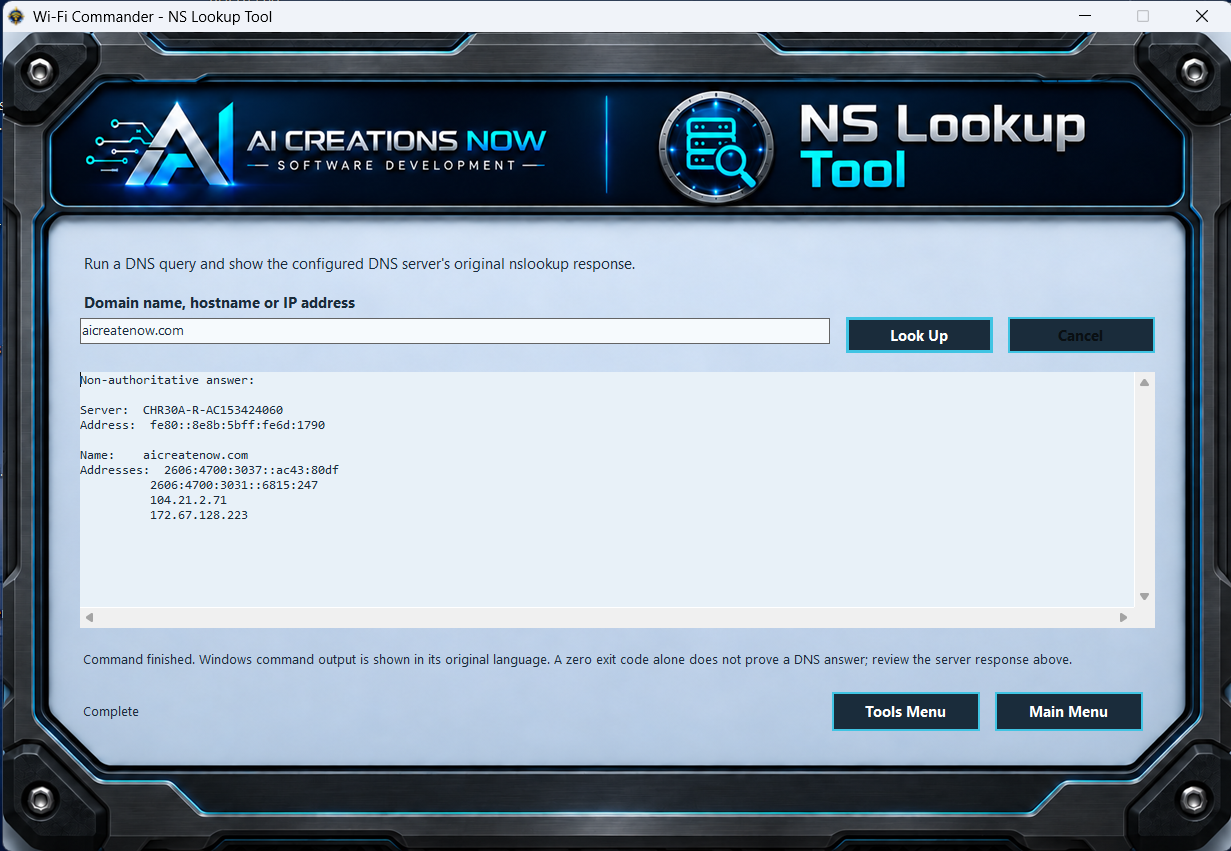
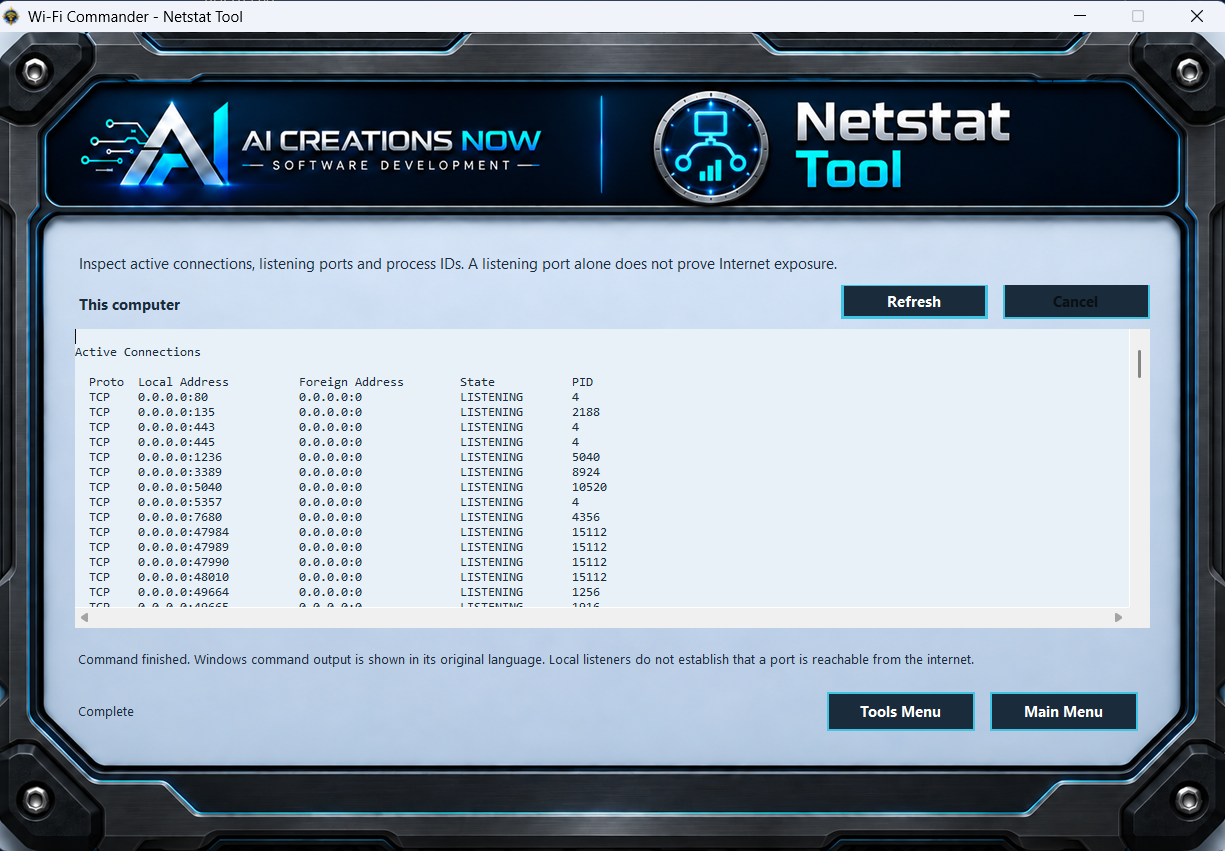
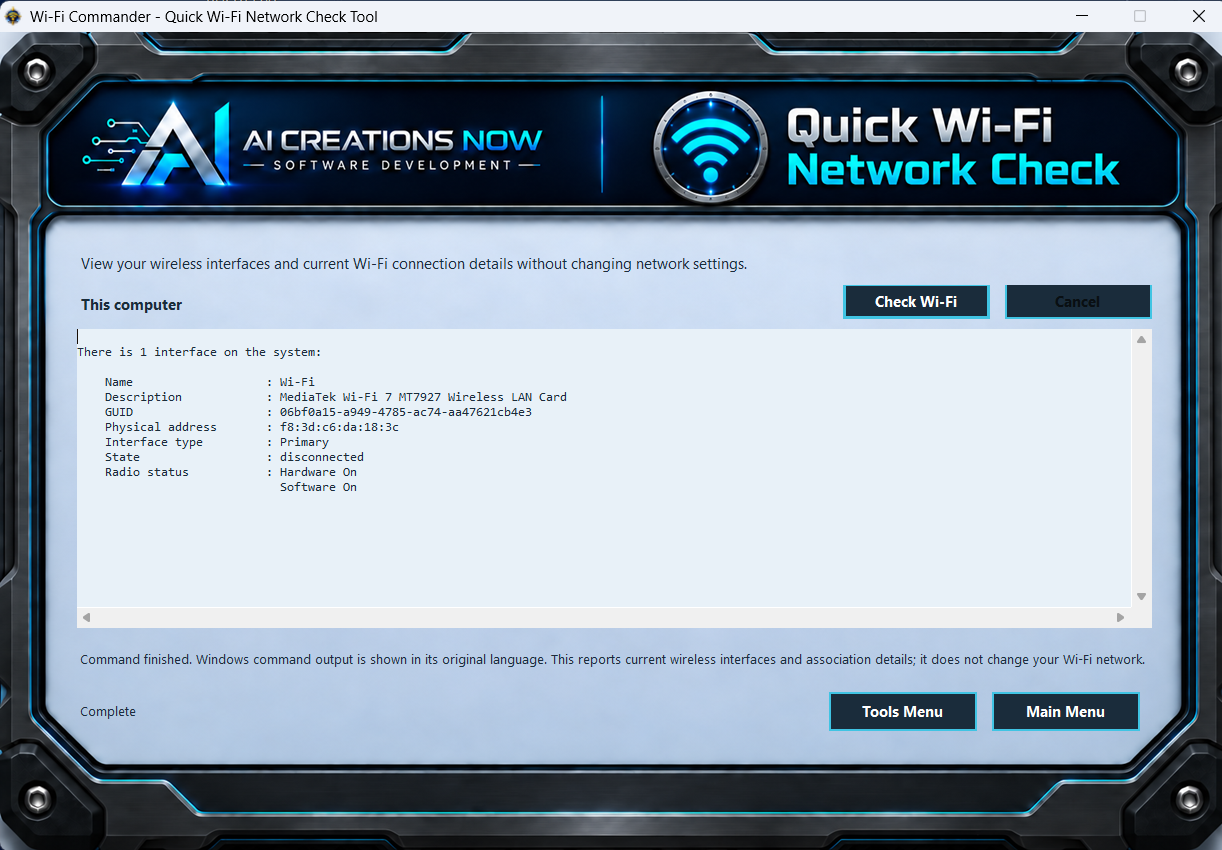
Choose from DNS Lookup, DNS Propagation, Ping, Traceroute, IP Config, NS Lookup, Netstat, Quick Wi-Fi Network Check, and Reset Remote Desktop History. Individual tools provide their own action, cancel, and return controls.
TWO DAYS TO EXPLORE YOUR CONNECTION
Put your network in focus.
Start in the room where you use Wi-Fi most. Choose your equipment, compare the signal, and see what your connection can tell you.
One computer · Windows x64 · No subscription